The 12-lead ECG : An In-depth Worked Example
Summary
Cardiac rate
Calculating the heart rate from the ECG is easy. Just count the number of large squares between two complexes on the rhythm strip and divide that number into 300.
For...
Summary
Cardiac rate
Calculating the heart rate from the ECG is easy. Just count the number of large squares between two complexes on the rhythm strip and divide that number into 300.
For example, there are four large squares between each QRS, therefore the rate on this strip is 75bpm:

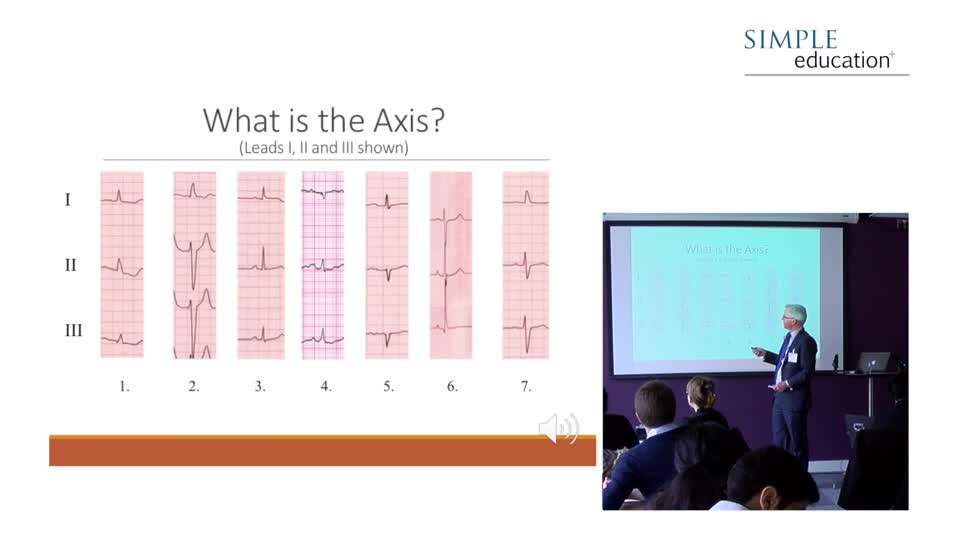
Cardiac Rhythm
Again this is straightforward. If there is a single p wave corresponding to each QRS with a broadly similar PR interval for each complex (as with the example shown above), it is likely you are looking at normal sinus rhythm (figure 7).
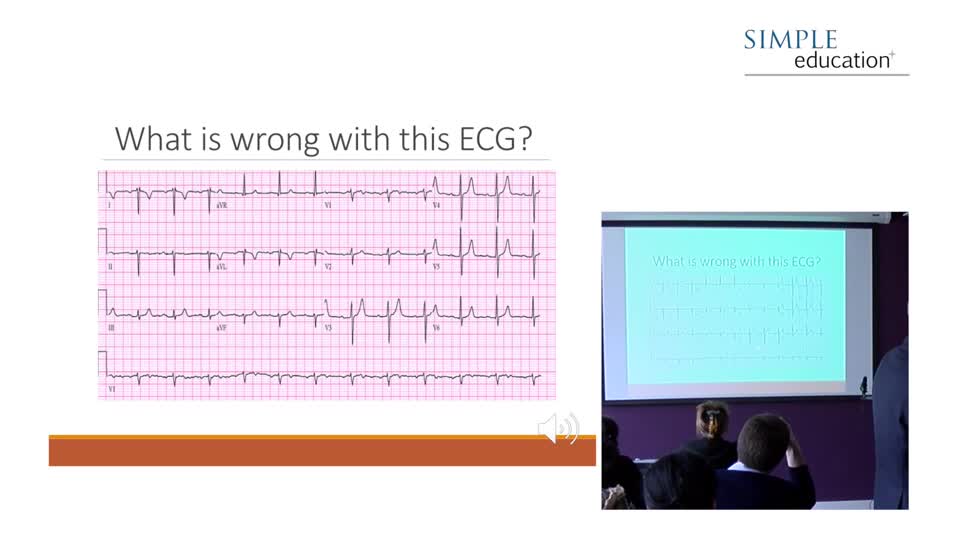
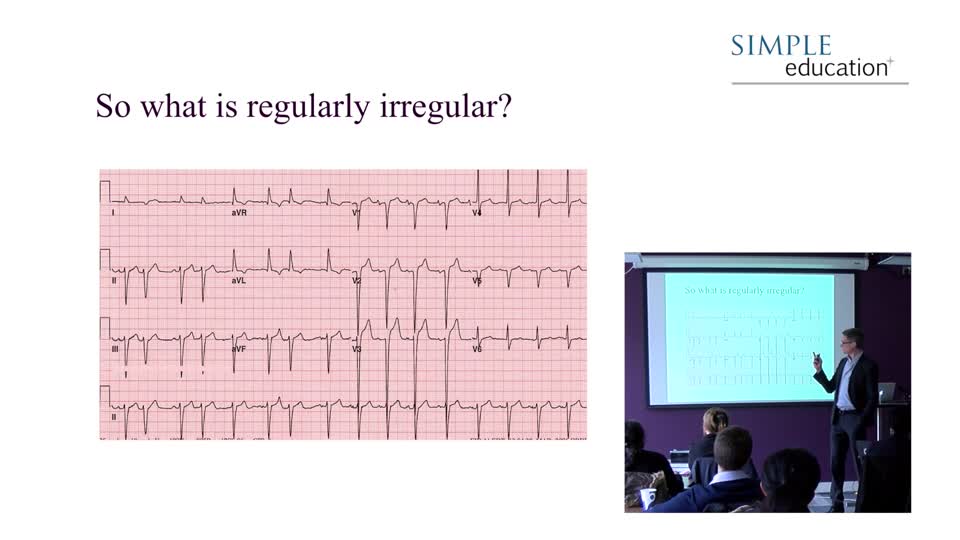
If there are no p waves visible and the distance from each QRS to the next varies unpredictably, it is likely you are looking at atrial fibrillation (figure 8). The baseline may show fibrillation waves, which are chaotic. They may occasionally look like a p wave, but not consistently. There will be more on this in later chapters.

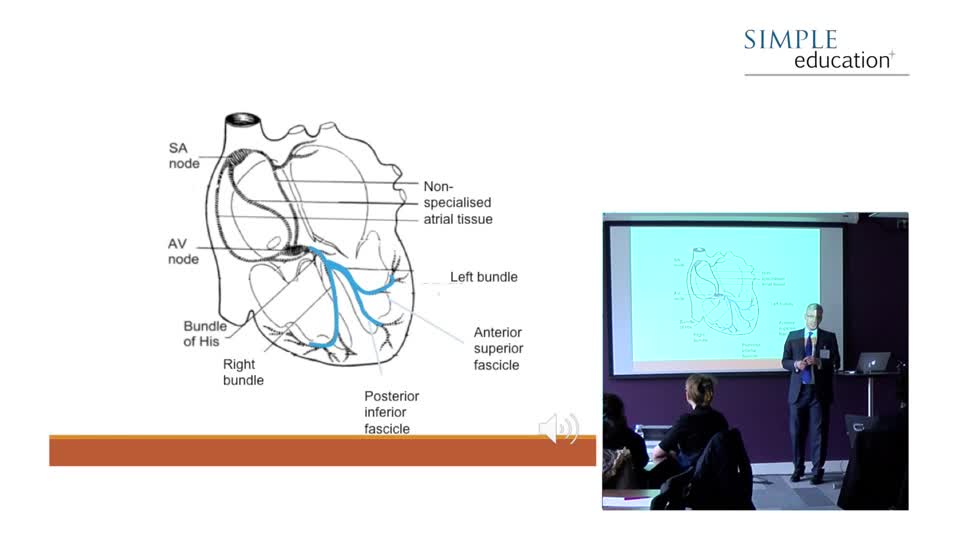
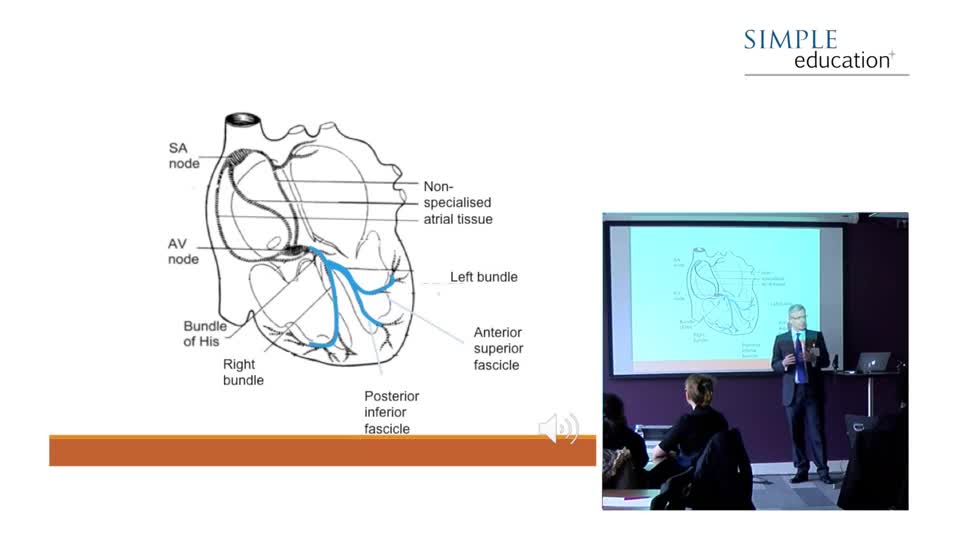
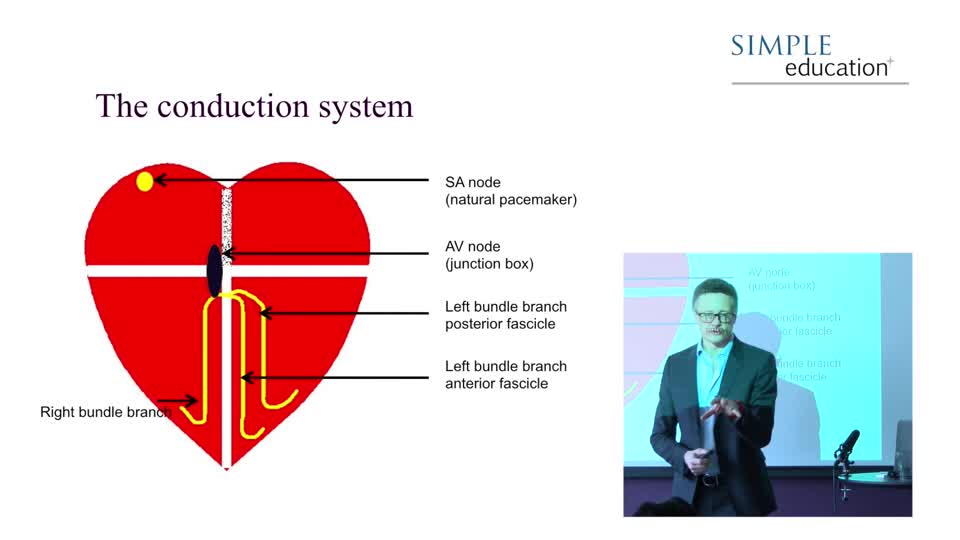
If there are no p waves visible before each QRS, but there exists a regular interval between each QRS there are several possibilities. Firstly, this may be a junctional rhythm, arising from the AV node or high up in the His-Purkinje system close to the AV node. Conduction occurs both forwards and backwards into the atria and ventricles simultaneously if AV nodal function is normal. If so, you may see ‘retrograde’ p waves visible within the QRS. Sometimes, however, retrograde p waves are not seen, and this usually means the p wave is buried within the QRS.

Simple Education, is a leading provider of coronary physiology and intracoronary imaging courses to aid treatment of complex coronary artery disease.
Speakers

Andrew Sharp
Prof Andrew Sharp qualified from Edinburgh Medical School in 1998 and is Professor of Cardiology... Prof Andrew Sharp qualified from Edinburgh Medical School in 1998 and is Professor of Cardiology at the University Hospital of Wales and Cardiff University in the U.K. He conducted his early training at the Royal Infirmary of Edinburgh, before moving to London for his senior clinical training. He completed the prestigious Milan-Imperial Interventional Cardiology Fellowship programme, having spent a year in San Raffaele and Columbus Hospitals, Milan, Italy, under the tutelage of Professor Antonio Colombo. He also spent three years training in interventional cardiology at Imperial College Hospitals in London. Prof Sharp was awarded an MD postgraduate research degree from the University of Edinburgh for his work on the hypertensive heart and his research interests include intracoronary imaging and physiology. as well as the use of device-based treatments for hypertension and pulmonary embolism.